Trace Compare: Compare vLLM traces across platforms
1:1 kernel mappings across providers. Diff huge vLLM traces fast with clean prefill vs decode.

TLDR
- Our new tool allows you to compare large vLLM traces in seconds – two gigabyte large traces take sub-30s
- Accurate 1:1 mapping of kernels across platforms (e.g. NVIDIA v.s. AMD). Find fusion opportunities and see why your model is slower compared to other platforms
- Clean prefill vs. decode kernel separation
The Problem
vLLM traces contain valuable information: what kernel launched where, how long it took, etc. But they're large and complex. Even with perfetto, it's difficult to look at one and get the full picture behind the trace – let alone compare it against another.
For example, given one trace from NVIDIA and one trace from AMD, the current process of mapping equivalent kernels is manual and painfully slow, prefill vs. decode separation is nearly impossible, and within all of that, fusion opportunities are needles in a haystack. Therefore, it's hard to tell from the perspective of either platform where their kernels are falling behind.
The Solution
Wafer's Trace Compare solves this in seconds.
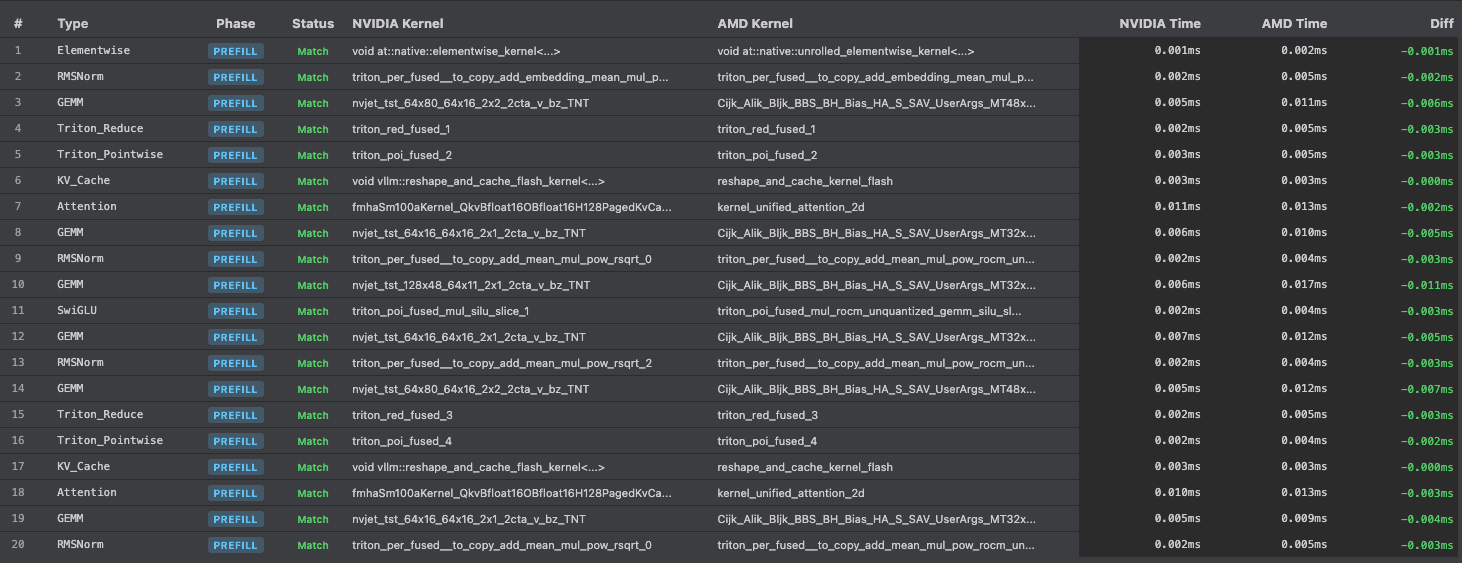
Input two traces and get a timeline of every kernel for the two platforms
See what kernel was called when, and the difference in performance. In prefill, NVIDIA consistently outperforms AMD's kernels.
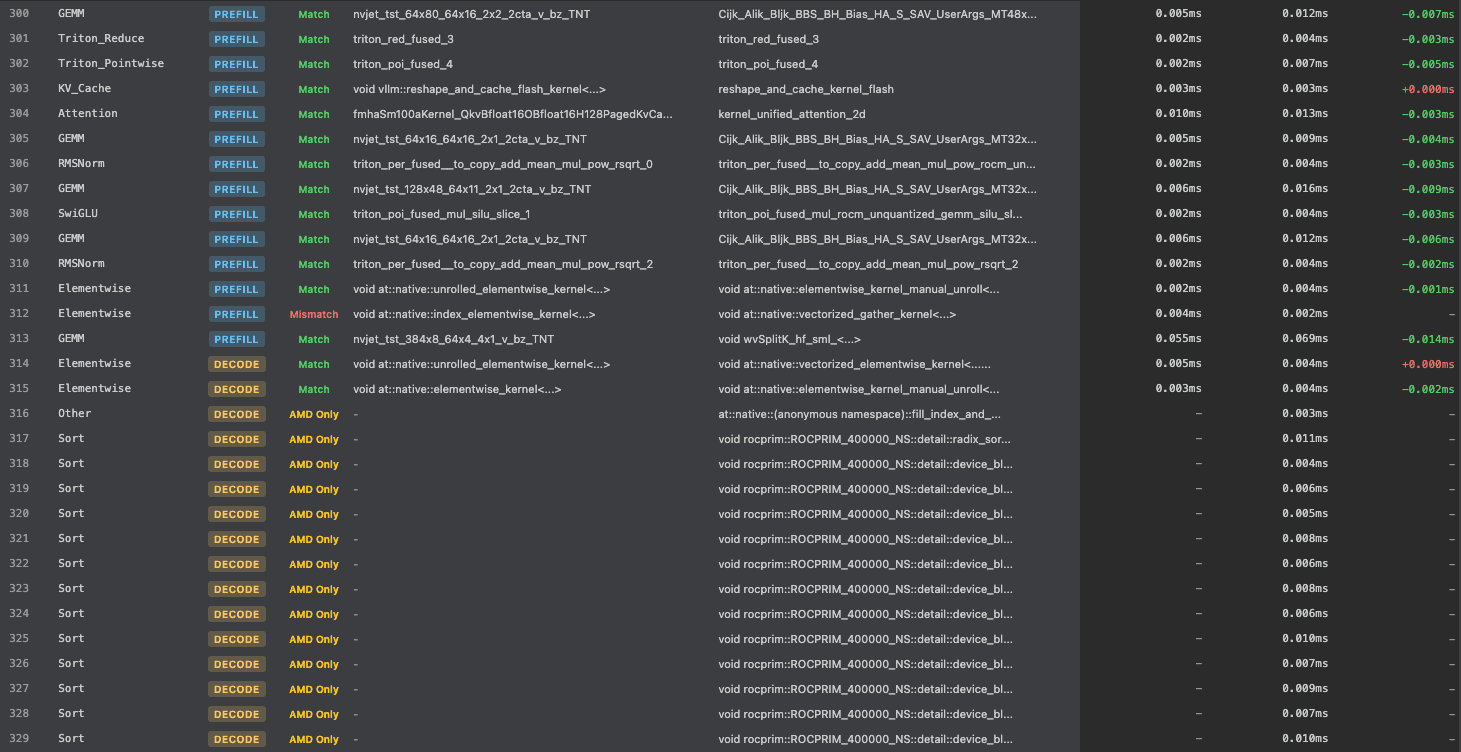
See exactly where decode starts and prefill ends
AMD starts its decode phase with many more sort kernels than NVIDIA does.
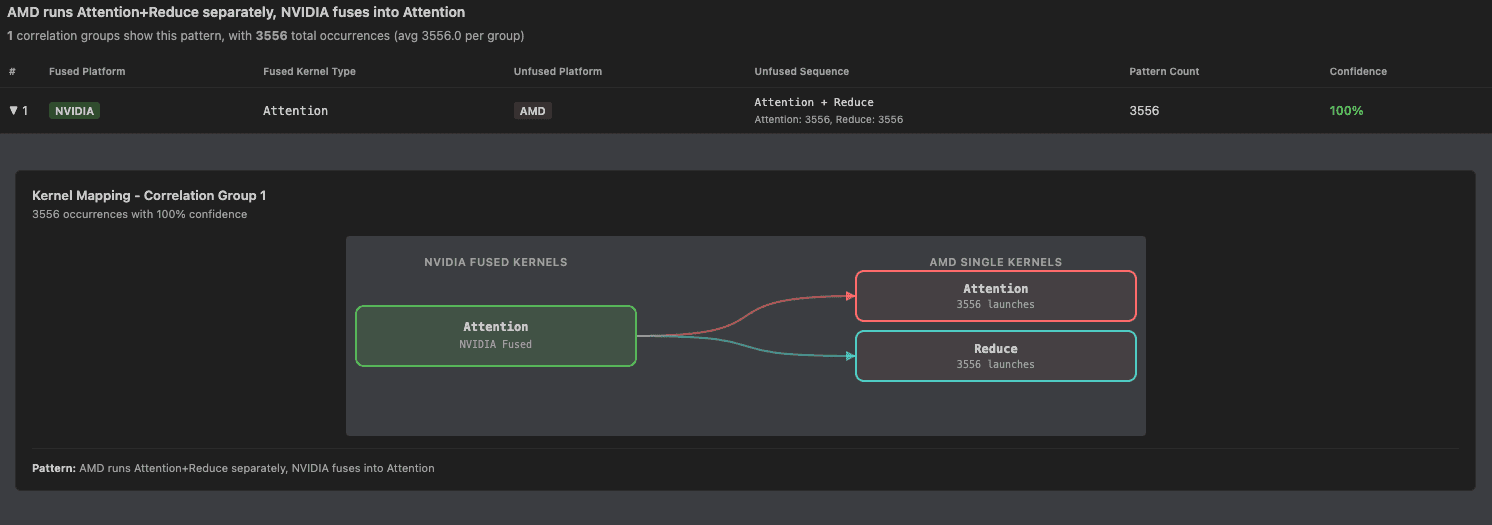
Find fusion opportunities immediately
In these two traces, NVIDIA fuses reduction into its attention kernels, whereas AMD does not.
Try it out today
If you'd like to run Trace Compare on your workloads, talk to us.
Give Us Feedback
If there's something else that would make your kernel development faster, let us know.
Reach out at emilio@wafer.ai or find us on Twitter/X.